The banks of the Brahmaputra River shift by up to 300m each year due to erosion. Here we used satellite images to visualise these changes in this dynamic river. Developed working at IHE Delft using the Google Earth Engine.
Satellite images give us an incredible new window into changes happening in large and remote regions where data was previously scarce. Amazing new visualisations are being produced, such as the AquaMonitor developed by Gennadii Donchyts at Deltares, which shows us where land has become water, or water has become land, over the entire globe.
The Brahmaputra River is very large, and very mobile. Identifying places where erosion is particularly severe over such a large basin, where ground data is so scarce, is a challenge. Using satellite images, we can obtain a relatively uniform data coverage over the whole basin. Google Earth Engine allows us to perform calculations on these images to highlight interesting regions.
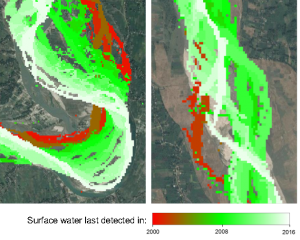
However, knowing which calculations need to be done is easier said than done! On such a complex river, identifying bank lines is difficult to impossible, so traditional methods for tracking bankline movement are not ideal. We tried various ways of colouring pixels to show cumulative erosion over years, basing the calculations on the AquaMonitor algorithm and on a surface water dataset produced by the JRC. The results flag up some useful results: for example, some tributaries are steadily moving in one direction, whilst others move back and forwards year-on-year (see right).
You can explore more changes in the Brahmaputra (and worldwide) using the web app.
Client
![]()